Microsoft Excel provides a robust feature known as 3D Maps, allowing users to visually represent geographical data. Follow these step-by-step instructions to insert and format a 3D map in MS Excel.
Step 1: Open Excel and Load Data
Open Microsoft Excel and load the spreadsheet containing your geographical data.
Step 2: Select Data
Highlight the data you want to include in the 3D map. This typically involves location names and corresponding values.
Step 3: Navigate to the 'Insert' Tab
Click on the 'Insert' tab in the Excel ribbon.
Step 4: Click on '3D Map'
Within the 'Insert' tab, locate and click on '3D Map' in the Charts group.
Step 5: Open 3D Maps
After clicking '3D Map,' select 'Open 3D Maps' from the dropdown menu.
Step 6: Map Configuration
The 3D map will open, displaying your data. Here, you can configure the map settings, such as data fields and visualization options.
Step 7: Add Fields
In the 3D Maps menu, add fields for locations and values. Select a location (e.g., city) and a corresponding value (e.g., sales).
Step 8: Customize Appearance
Customize the appearance of the map by adjusting settings such as color, size, and shape of data points. Experiment with different options to enhance visual representation.
Step 9: Explore Map Interaction
Use the mouse to zoom in or out and rotate the map for a better view. Explore interactive features to understand the distribution of data.
Step 10: Layer Options
Access 'Layer Options' to further customize colors and styles based on your preferences.
Step 11: Tour Editor
Utilize the 'Tour Editor' to create a guided tour through your 3D map. Define key points and viewpoints for effective storytelling.
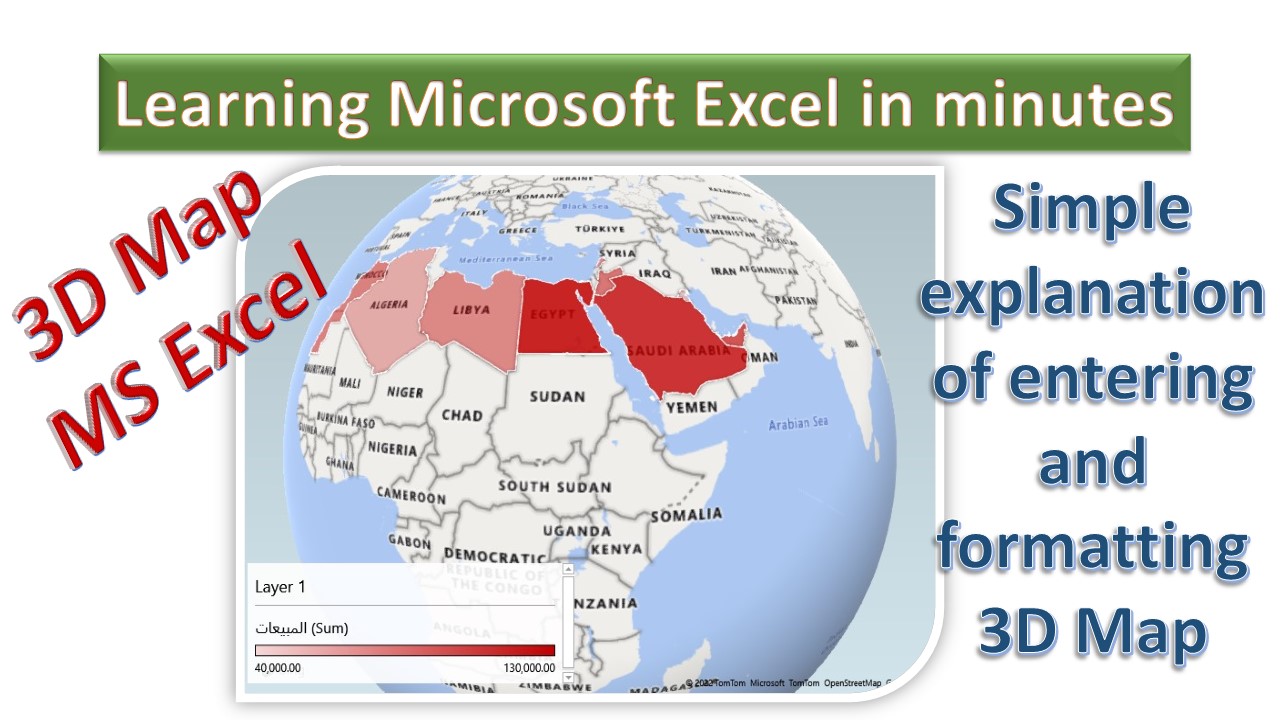
Step 12: Map Labels
Toggle 'Map Labels' to display country names on the map, providing additional context.
Step 13: Flat Map
Switch to a 'Flat Map' view if a three-dimensional representation is not required.
Step 14: 2D Chart
Insert a 2D chart based on your 3D map data for traditional data representation.
Step 15: Themes
Apply 'Themes' to quickly change the visual style of your 3D map.
Step 16: Create Video
Generate a video presentation of your 3D map by clicking 'Create Video.' Choose quality settings and save the video file.
Step 17: Text Box
Enhance your map with a 'Text Box' to add titles or descriptions for better clarity.
Step 18: Capture Screen
Capture the screen to create an image of your 3D map. Right-click and paste the image into other documents or presentations.
Congratulations! You have successfully inserted and formatted a 3D map in MS Excel, leveraging various features for an insightful and visually appealing representation of your geographical data.