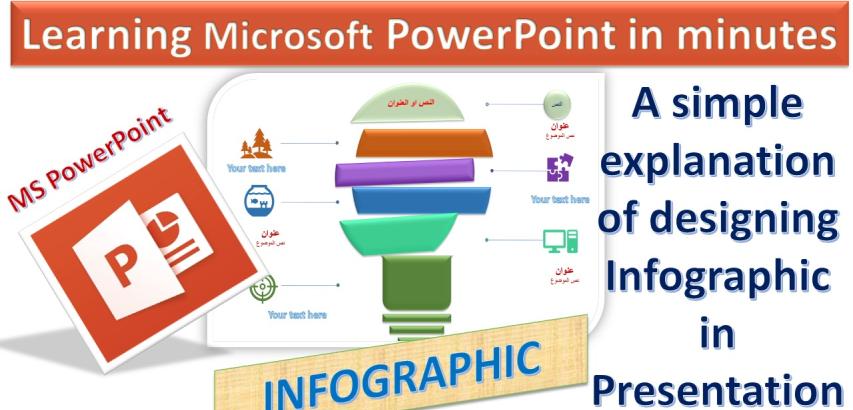
Designing an infographic using MS PowerPoint can be a powerful way to convey information visually and engagingly. Here's a step-by-step guide on how to create an infographic using PowerPoint:
Step 1: Define Your Objective Begin by defining the purpose and objectives of your infographic. What information do you want to convey? Who is your target audience? Understanding your goals will help shape your design.
Step 2: Gather Data and Content Collect all the data, statistics, and content you want to include in your infographic. This could be in the form of text, images, charts, or graphs. Ensure that your data is accurate and relevant.
Step 3: Open PowerPoint and Set Up Your Slide Open PowerPoint, and create a new presentation. Decide on the dimensions of your infographic. Go to the "Design" tab and select "Slide Size." You can choose a custom size that suits your infographic layout.
Step 4: Choose a Layout Select a layout that works best for your infographic. You can create a custom layout or use one of the built-in templates. Ensure that the layout allows you to present your data logically and attractively.
Step 5: Add Titles and Headings Insert titles and headings to introduce your infographic's sections. Use clear and concise language, and consider using larger fonts for titles to grab attention.
Step 6: Insert Visual Elements This is where the core of your infographic comes to life. Insert images, icons, charts, graphs, or any visual elements that best represent your data. To insert visual elements, go to the "Insert" tab and select the type of content you want to add.
Step 7: Arrange and Align Organize your visual elements and text blocks. Ensure proper alignment and spacing for a clean and professional look. Use PowerPoint's alignment and distribution tools for precision.
Step 8: Add Text and Labels Incorporate textual content to explain your visual elements and provide context. Use bullet points, labels, and short, impactful text to guide your audience through the infographic.
Step 9: Color and Styling Choose a color scheme that aligns with your message and branding. Consistency in color and style helps create a cohesive and appealing infographic.
Step 10: Utilize Icons and Symbols Icons and symbols can help convey information quickly. PowerPoint offers a wide range of icons you can use to illustrate points or create visual metaphors.
Step 11: Create Visual Flow Ensure there's a logical flow to your infographic. Use arrows, lines, or numbered lists to guide readers through the information in a structured way.
Step 12: Add Charts and Graphs If your data involves statistics or comparisons, consider adding charts or graphs. PowerPoint's "Insert Chart" feature makes it easy to create visually appealing charts.
Step 13: Review and Edit Proofread your content and review the design. Ensure that your infographic is easy to understand and visually appealing. Make adjustments as needed.
Step 14: Save and Export Once you're satisfied with your infographic, save your PowerPoint file. To share it online or in print, you can export it as an image (e.g., JPEG or PNG) or as a PDF.
Step 15: Share Your Infographic Now that your infographic is ready, share it through your preferred channels, whether it's on your website, social media, in presentations, or printed materials.
Designing an infographic using MS PowerPoint allows you to create visually engaging content to effectively convey complex information. With practice and creativity, you can design infographics that capture your audience's attention and deliver your message effectively.
